Animation
The animation tab is one of the primary outputs of the simulation. It is a powerful reporting tool and visually shows the result of the simuluation run. The tab consists of several key components which are outlined below.
Time Control
Sliders
The Animation includes sliders that allows users to control the animation, moving it forward or backward through time.
Four sliders are available for time control: one for the overall timeline, and others for adjusting time with increasing granularity—by day, hour, and minute.
Toolbar
Along with the sliders, a toolbar exists that includes buttons for quick time adjustments, allowing jumps forward or backward by set intervals. The toolbar also features a dropdown menu for selecting the playback speed, enabling precise control over the simulation's time progression
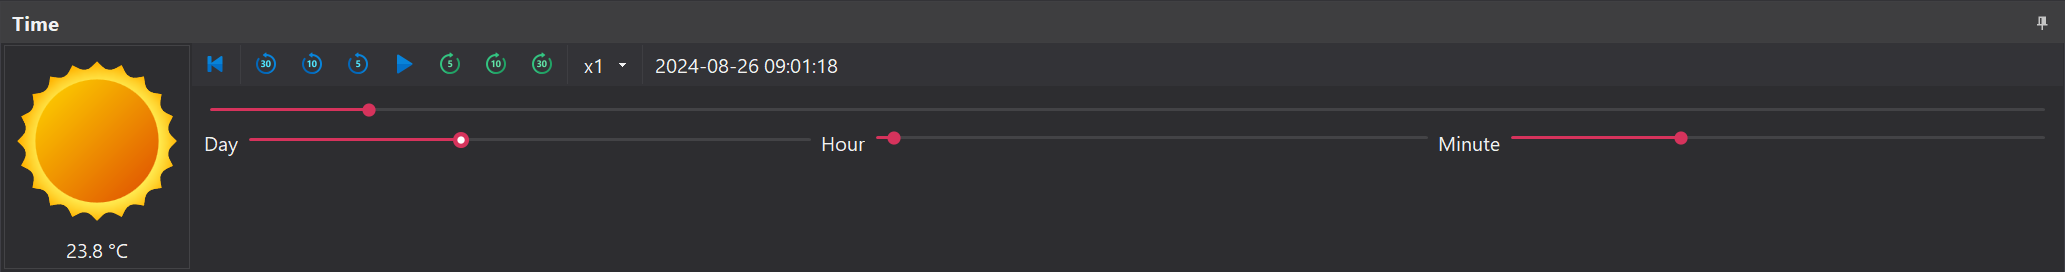
🌤️ The weather icon on the left side of the Time Control indicates the current weather conditions and displays the corresponding temperature 🌡️.
Items
This tab displays a tree list of Items previously added through the Items tab of the Navigation pane. The tree list mirrors the structure of the Items step, organising entries under Mobile and Fixed categories.
Clicking on a Mobile Item in the list will cause two additional tabs to appear. These tabs are outlined below.
Properties
The Properties tab lists the attributes of the selected item, dynamically updating their values as the slider moves. At any point in time, these attributes reflect the item's current state in the animation.
The tables below provide a detailed description of each attribute.
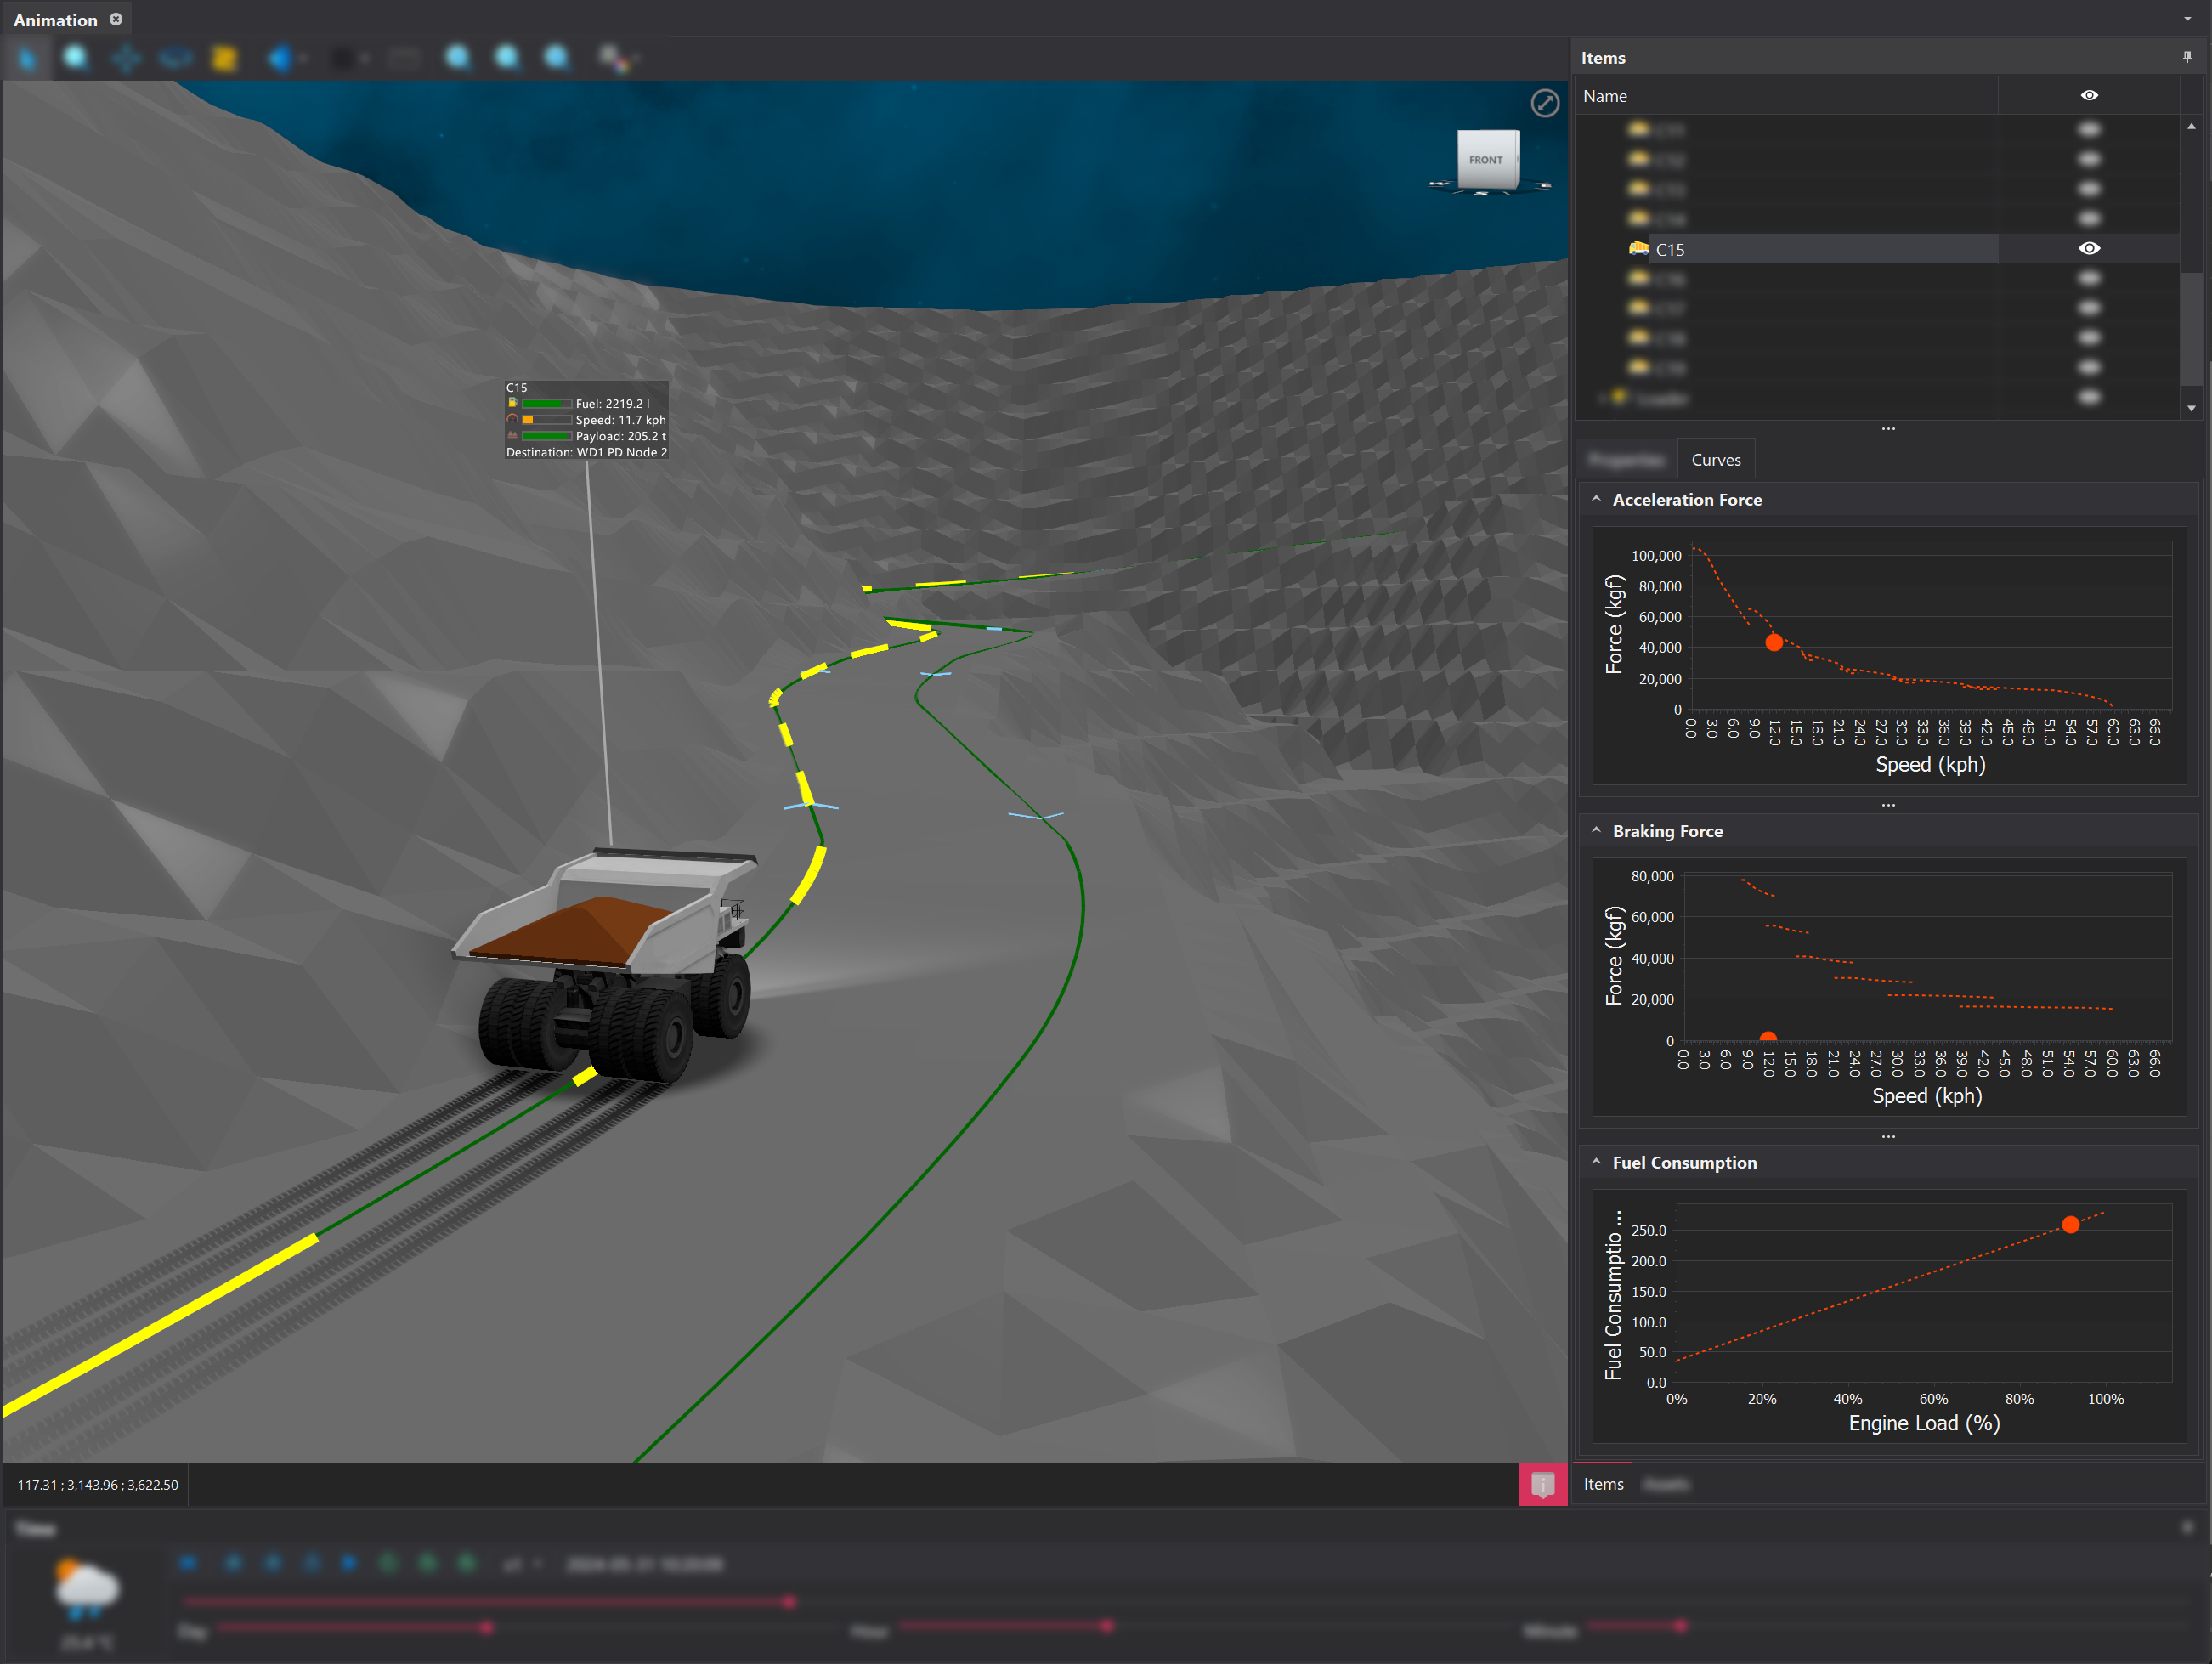
Truck

| Property | Description |
|---|---|
| Name | The name of the selected equipment item. |
| Gradient | The gradient (slope) of the road the truck is currently traversing. |
| Speed | The current velocity of the truck. |
| Engine Load | The percentage of engine capacity currently being utilised. |
| Battery Charge Number | The number of charge cycles the truck's battery has undergone. |
| Battery Energy | The remaining battery capacity, indicating how much charge is left in the truck's battery. |
| Fuel Level | The amount of fuel remaining in the vehicle, expressed as a percentage of full capacity. |
| Gear | The currently engaged gear. |
| State | The main activity of the equipment, such as "Traveling to Loader", "Dumping", or "Loading Truck". |
| Sub-State | A more specific action or condition within the current state, such as "Accelerating" or "Slowing due to traffic". |
| State Time Remaining | he remaining time the equipment will continue its current state. |
| Sub-State Time Remaining | The remaining time the equipment will continue its current sub-state. |
| Destination | The target location the truck is headed towards. |
Battery properties will only be present if the Power Source of the truck has been set to Battery 🔋⚡.
When a truck is being loaded, the Sub-State will display the stages of the load cycle: Dig, Loaded Swing, Dump, and Unloaded Swing ⛏️.
Loader
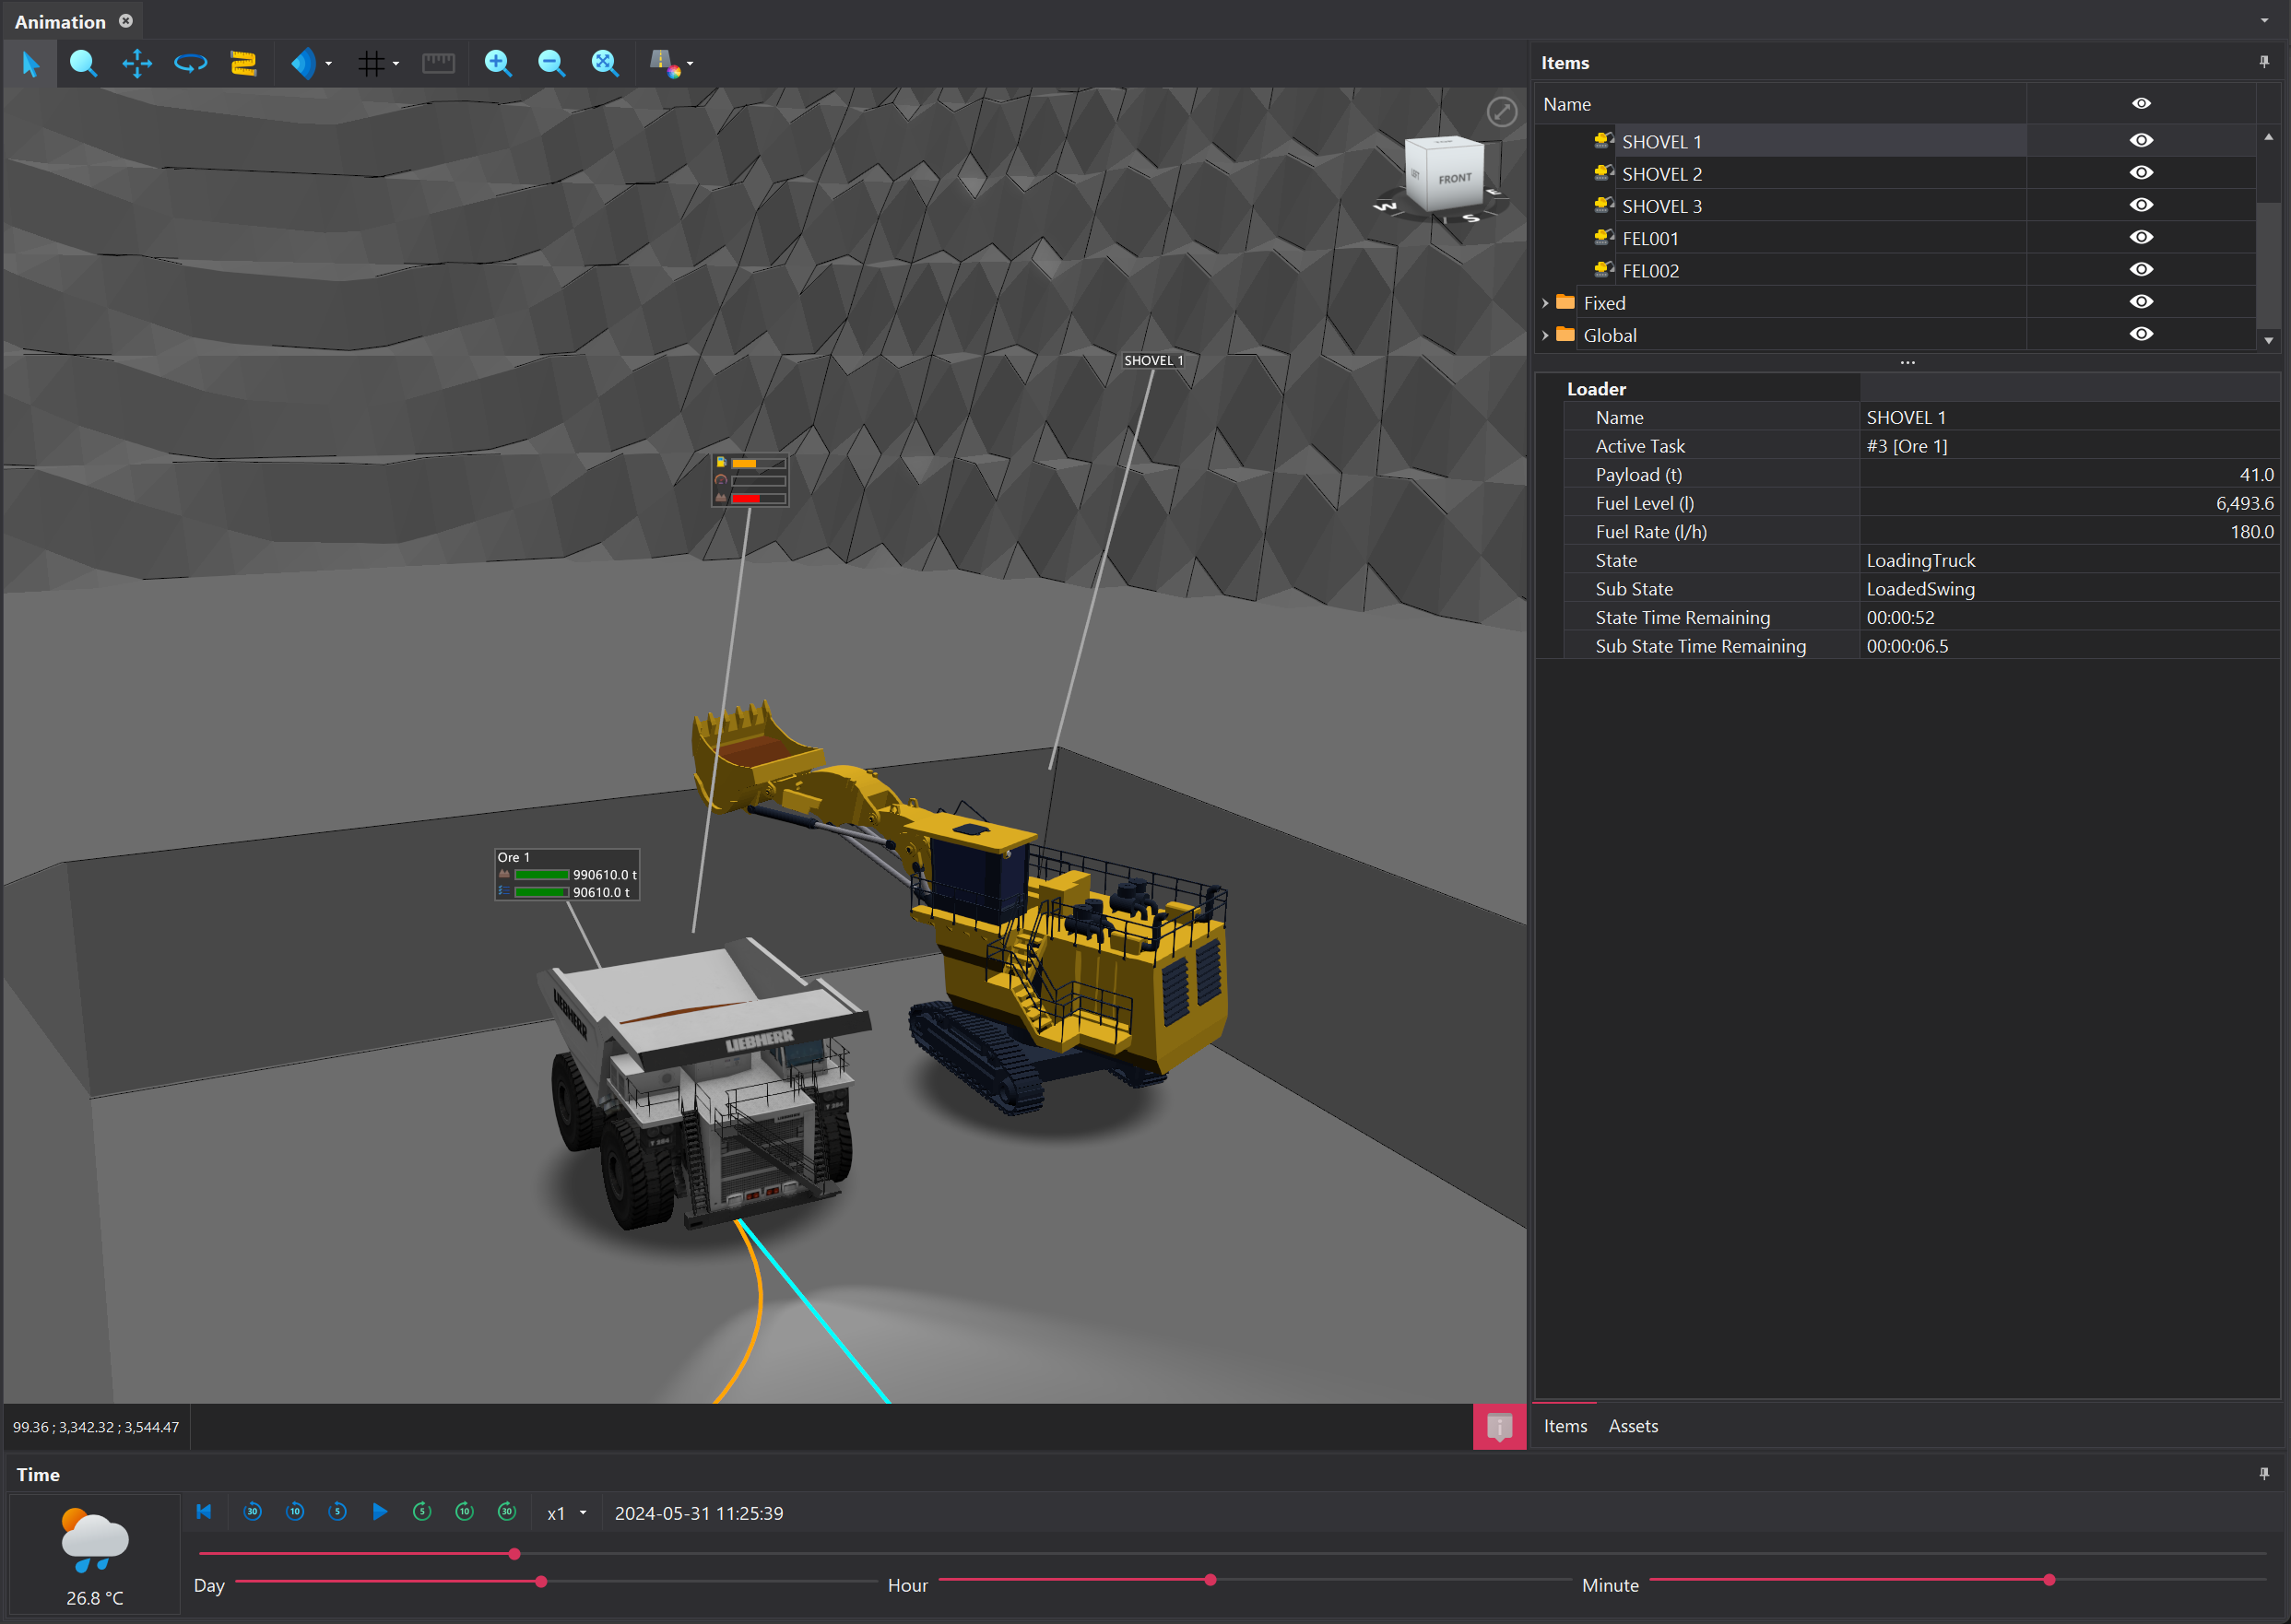
| Property | Description |
|---|---|
| Name | The name of the selected equipment item. |
| Active Task | The task currently being executed, formatted as the task priority followed by the name of the source block |
| Payload | The weight of the material in the bucket currently being loaded. |
| Fuel Level | The amount of fuel remaining in the vehicle, expressed as a percentage of full capacity. |
| Fuel Rate | The rate at which fuel getting consumed, typically measured in units per hour. |
| State | The main activity of the equipment, such as "Traveling to Loader", "Dumping", or "Loading Truck". |
| Sub-State | A more specific action or condition within the current state, such as "Accelerating" or "Slowing due to traffic". |
| State Time Remaining | The remaining time the equipment will continue its current state. |
| Sub-State Time Remaining | The remaining time the equipment will continue its current sub-state. |
Curves
The Curves tab applies exclusively to trucks and displays the performance curves for Acceleration, Braking, and Fuel Consumption. For battery-powered trucks, these curves are automatically adjusted to account for power usage and regenerative braking.
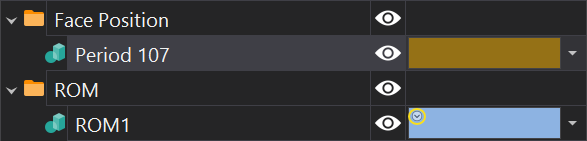
Assets
This tab displays the Assets that have been loaded into the project. The organisation and strucutre of the assets mirrors that of the Assets tab.
In addition to the name column, there are two more columns:
Middle Column: Featuring an eye icon, this column controls the visibility of the asset in the viewport.
Far-right Column: Featuing a color box, this column controls the asset's display settings. These display settings can be overridden from their inherited appearance. More information on this can be found here.
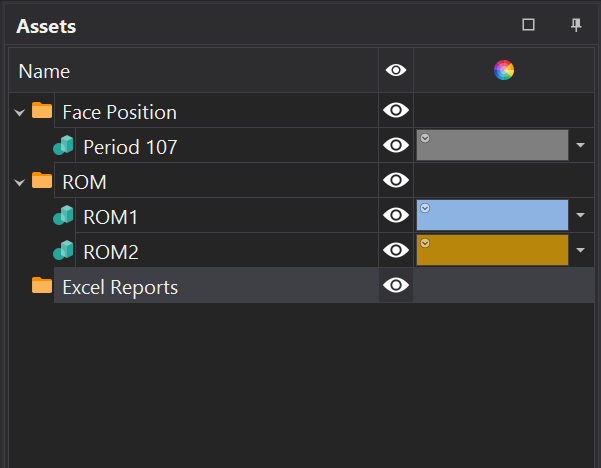
🔍 If an Asset's appearance has been overridden, you will not see the little circle with a downward arrow head in the top left corner of the color box.'.
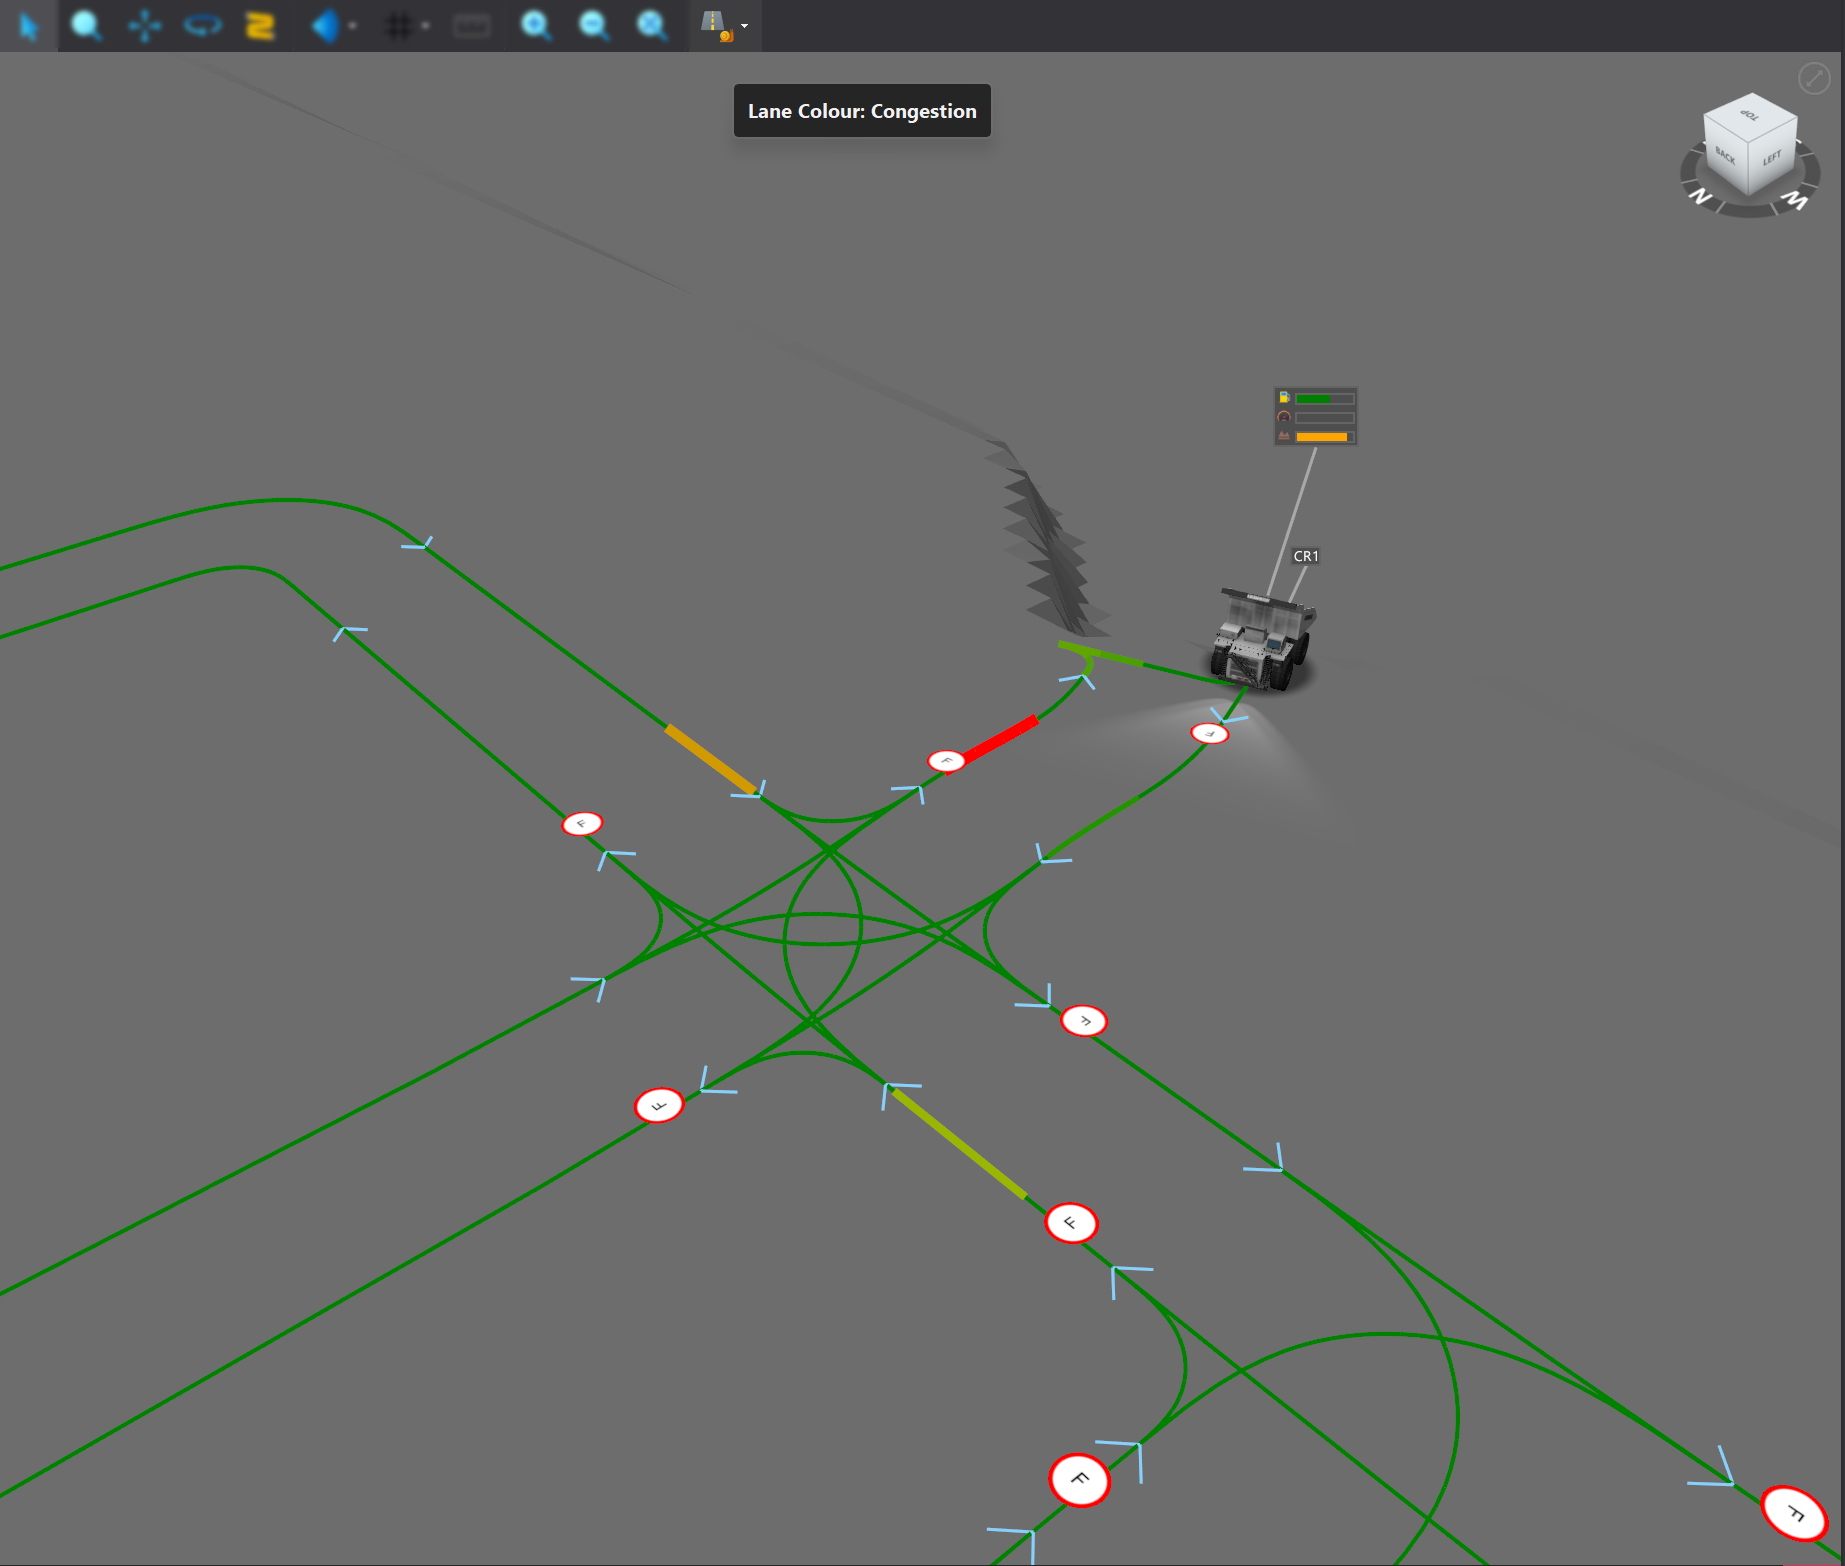
Viewport Toolbar
The Viewport Toolbar offers tools for managing the viewport within the Animation tab. Detailed information about these tools and their functionality is available here.
Additionally, the toolbar also includes unique shading options for visualising simulation outputs, such as lane usage and congestion. These features help quickly identify bottlenecks and evaluate road utilization, providing valuable insights into network performance.